


Efficient, Effective Forecast Calls
You went from CMO to CRO and now you're running and owning the Forecast Calls

Former sales leaders have told me they dread the forecast calls when things are not moving. One even described it as “death by a thousand paper cuts.”
In this post I will cover:
Setting the format and agenda for the forecast call
Who should attend a forecast call and their respective roles
What should a forecast dashboard look like
Samples of dashboard reports
Format and agenda of the forecast call
When I went from CMO to CRO one thing I did straight out of the gate was reorganize the forecast call. I had introduced the concept when I was CMO but it was run by Sales. Now was my chance to restructure the format.
First, I let my CEO know I wouldn’t be discussing the forecast during our 1:1s because it was repetitive and things change on a dime in sales and marketing.
I made sure I had the right people there and they knew their roles.
I automated the forecast dashboard via Salesforce so it emailed all the attendees BEFORE the meeting (usually the night before) so they could come prepared with questions.
Finally, I set an agenda using the Salesforce forecast dashboard moving through the dashboard not covering every report but just the important ones (more on the reports below).
Who should attend the forecast call
The forecast call should be weekly and it should include the Sales Ops, CEO, CFO/Head of Finance, Sales leaders with direct reports, CMO/Head of Marketing, Head of Customer Success, and if there is room, the Demand Gen person. Personally, I like to run them on Friday mornings, but that’s a personal preference.
The forecast call is there to basically help the CEO and Finance folks understand week to week what’s happening so they can factor in and rework their business model to best predict the outcome for the quarter and for the year.
Seems simple enough except when sales velocity is slow or marketing activities are spread out too far apart in a quarter. Then you find yourself with giving the same update as the week before and answering the same questions over and over.
Roles of people attending the forecast call
CRO/VP of Sales - should lead the meeting
Sales Leaders - should talk about their area that they manage (inbound, outbound, SDR meetings, AE meetings, etc
Sales Ops - should lead the navigation of the dashboard
CEO - you are giving them an update so they can be prepared for the board or any surprises
Finance - they are there to listen and ask questions to anyone and any news that impacts their model. Expect the unexpected.
VP/Head of Customer Success - provides an update on renewals, upsells, and maybe expansions
CMO/Head of Marketing - provide an update on lead gen and pipeline, what’s working and what they’re hearing in the market
Head of Demand Generation/ABM - provides an update on acquisition pipeline and campaigns impacting sales
What should the forecast dashboard look like?
The forecast dashboard is just that — a forecast. A prediction of what the future will look like based on current data and you need to interpret it.
Every company’s forecast dashboard is different, however, there are core metrics that need to be covered.
For Sales led, it should include the following at a minimum:
Quota attainment, overall, and by rep
Current and next quarter pipeline
QTD Renewals by stage, % likely to close
But there are many other things to look at and include depending on what your CEO & CFO want to see.
Well run forecast meetings shouldn’t take more than 30 minutes
Samples of some dashboard reports I’ve used in the past:
QTD (quarter to date) sales quota attainment, overall and by rep

QTD pipeline, overall and by rep
QTD pipeline by deal stage, by rep, and by new biz vs upsell/add-on
QTD pipeline by age, by rep
QTD bookings by age, by rep
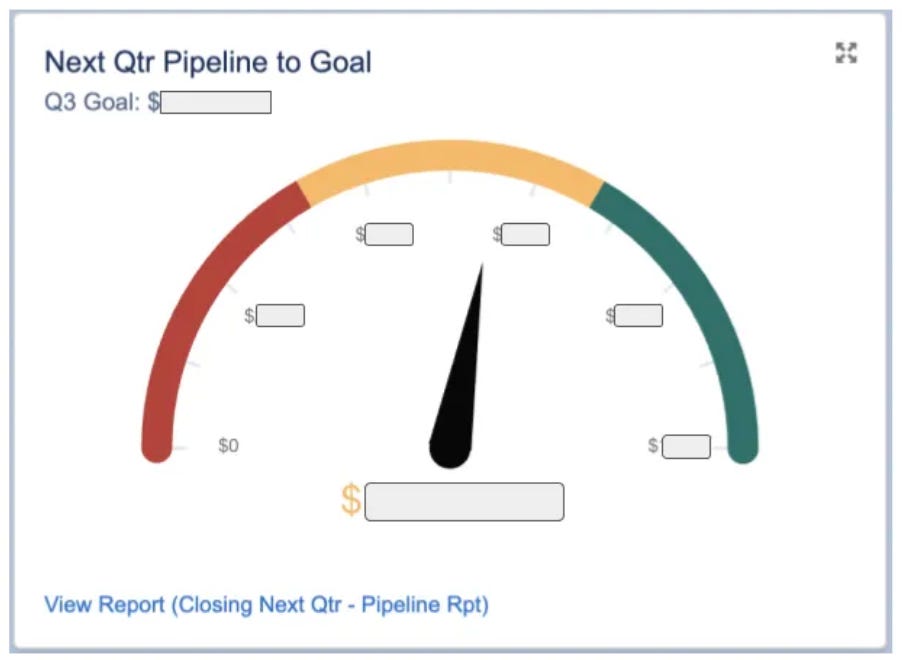
Next Quarter pipeline to goal

Sales Rep pipeline this quarter and next quarter

# new meetings by week, by sales stage, (optional to also splice it by rep)

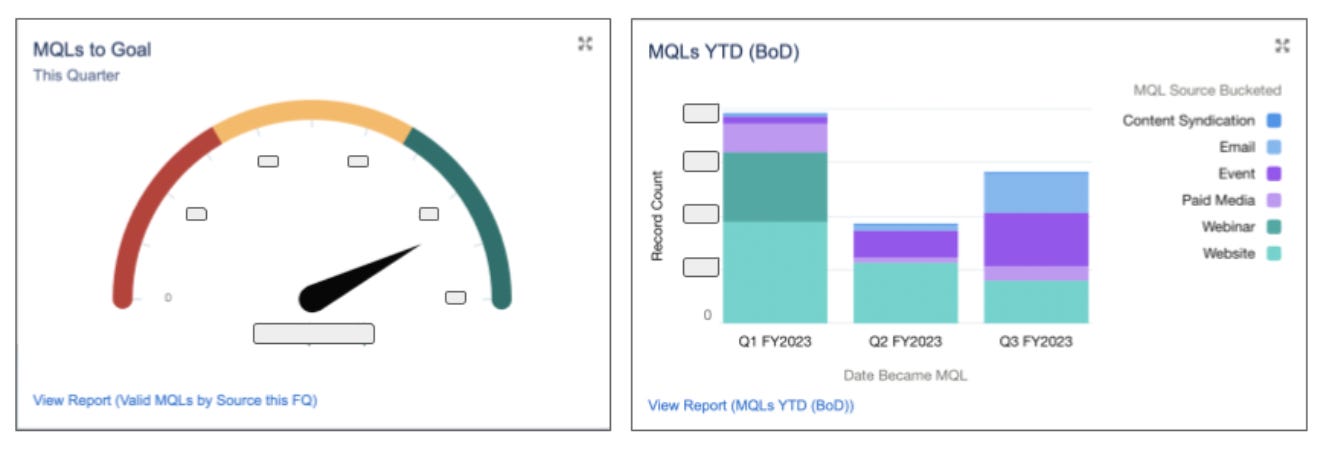
QTD MQLs, overall and by channel
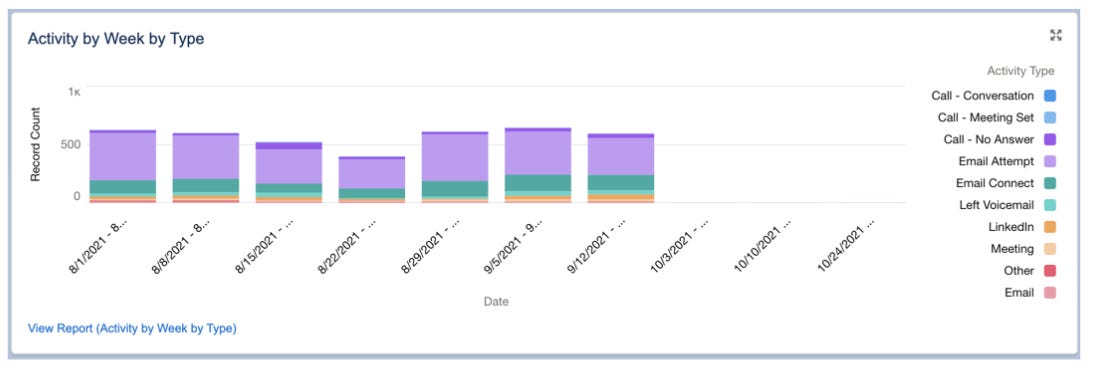
BDR/SDR activity type, by week, by rep
QTD closed/lost by reason (why you lose, who you lose to, where/what stage are you losing)

Renewals, by stage, % confidence to close, close date


…and anything else important to your business.
If you have a PLG or a blend of Sales Led and PLG models, then you also need to include these reports, however, I would consider a separate meeting to review these so you can invite product to the table for discussion:
# of inquiries or new signups, measured QTD by day, week, month
# of inquiries/signups by channel, by week, month, quarter
# of conversions by cohort by day/week/month/quarter
QTD pipeline by month
QTD bookings by month
Adoption metrics - you should be able to see where the end user is engaging, steps they’ve taken, and where they are getting stuck.
Measurement frequency
As a person who ran a BI (Business Intelligence) unit for almost a decade, I can speak with confidence and certainty that there is very little data that should ever be measured by day unless you are in product (or a micromanager). #truth
Most data points in sales and marketing don’t change frequently enough to give you any real insights in such a short time period.
I never look at data more than once a week unless there is a good reason such as monitoring a low performer’s output or checking in on a new campaign to make sure everything is running as expected.
Typically you can get analysis paralysis by looking at data too frequently. Data is good for looking at trends and seeing where things are going. You can have a blip in any data for a day or two, even a week, but when you look at it too often you’re trend analysis is blinded by not seeing the forest for the trees.
I hope this was helpful. Thanks for reading.